In today’s data-driven world, being proficient with the right tools is essential for any analyst looking to make impactful decisions. With vast amounts of data at our fingertips, choosing the right data analytics tools can be overwhelming. However, the right tools can transform raw data into meaningful insights, driving success in any industry. In this post, we’ll walk you through the top 8 data analytics tools that every analyst should know. These tools not only streamline your workflow but also empower you to unlock the full potential of your data. So, let’s dive in and explore how each of these tools can enhance your analytical skills.
Table of Contents
- Why should we use tools for Data Analytics?
- What is the Data Analysis Process?
- What are the Top Data Analytics Tools?
- What are the Benefits of Using Data Analytics Tools?
- How to Choose the Right Data Analytics Tool?
- Conclusion
- Frequently Asked Questions (FAQ)
Why should we use tools for Data Analytics?
Streamlining Data Processing
Data analytics tools significantly speed up the processing of large datasets. What would take hours or even days manually can be done in minutes with the right tools. This efficiency allows analysts to focus on interpreting results rather than getting bogged down in data preparation.
Enhancing Accuracy and Reducing Errors
Manual data analysis is prone to human error, which can lead to inaccurate conclusions. Data analytics tools, however, are designed to minimize these errors. By automating calculations and data cleaning processes, these tools ensure that your analysis is both accurate and reliable.
Facilitating Better Decision-Making
With the insights provided by data analytics tools, businesses can make more informed decisions. These tools help identify trends, uncover patterns, and predict future outcomes, giving companies a competitive edge in their industry.
Saving Time and Resources
By automating repetitive tasks, data analytics tools save valuable time and resources. This efficiency not only improves productivity but also allows teams to allocate their time and effort to more strategic activities, such as developing new business strategies or exploring innovative solutions.
Increasing Accessibility to Complex Data
Not everyone is a data scientist, but data analytics tools make it easier for non-experts to understand and work with complex data. With user-friendly interfaces and visualization features, these tools democratize data access, empowering more people within an organization to contribute to data-driven decision-making.
What is the Data Analysis Process?
- Define the Problem : Start by clearly identifying the question or issue you want to address. Understanding the problem sets the direction for your analysis.
- Collect Data : Gather relevant data from various sources, such as surveys, databases, online resources, or existing records.
- Clean the Data : Review and clean the data to eliminate errors, duplicates, or inconsistencies. This step is crucial for ensuring accuracy in your analysis.
- Organize the Data : Structure the data in a way that makes it easy to analyze. This may involve categorizing, labeling, or formatting the data appropriately.
- Analyze the Data :
- Statistical Analysis : Apply statistical methods to explore relationships and trends within the data. This helps identify significant patterns that can inform decisions.
- Machine Learning Algorithms : Utilize machine learning techniques to build predictive models. These algorithms can uncover complex patterns and provide insights beyond traditional statistical methods.
- Visualize the Data : Leverage data visualization tools to transform your data into engaging charts, graphs, and dashboards.
- Interpret the Results : Evaluate the findings and draw conclusions based on the analysis. Consider the implications of the results in relation to the original problem.
- Communicate Insights : Present the findings through reports, visualizations, or presentations. Clear communication of insights is essential for informing decision-makers and stakeholders.
Read More about Data Analytics : How to use Data Analytics for your Business Growth?
What are the Top Data Analytics Tools?
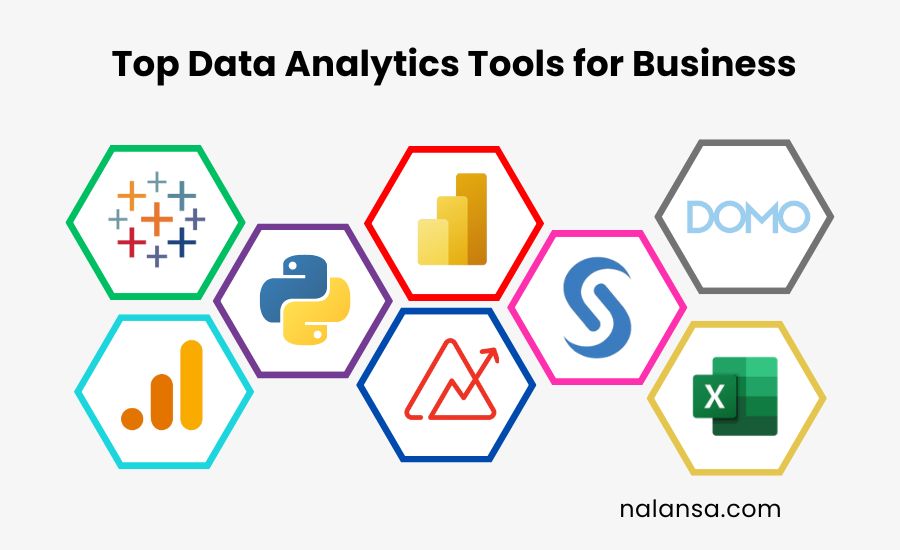
Here’s a list of some of the top data analytics tools available today :

1. Tableau : Data Analytics tools
Data Visualization and Business Intelligence
Tableau is a leading data analytics tool that connects to various data sources, creating interactive dashboards and reports. With Tableau, businesses can easily connect to their data, create interactive dashboards, and share insights across the organization. Tableau’s user-friendly interface and robust features make it a popular choice among data analysts and business users alike. Its data visualization capabilities allow users to create interactive dashboards, reports, and stories that facilitate data-driven decision making.
Key Features :
- Data visualization
- Real-time analytics
- Collaboration tools
- Cloud-based platform
- User-friendly interface
2. Power BI : Data Analytics tools
Business Analytics and Reporting
Power BI is a comprehensive business analytics tool that provides real-time insights and reporting capabilities. Power BI helps businesses create interactive reports, visualize data, and gain insights into their operations. Its integration with Microsoft products makes it a popular choice among businesses already using Microsoft tools. Power BI’s advanced analytics capabilities allow users to create complex data models, perform predictive analytics, and create interactive visualizations.
Key Features :
- Data modeling
- Visualization
- Reporting
- Artificial intelligence integration
- Microsoft product integration
3. Google Analytics : Data Analytics tools
Web Analytics and Optimization
Google Analytics is a widely used web analytics tool that tracks website traffic, behavior, and conversion rates. Google Analytics helps businesses understand their website traffic, identify areas for improvement, and optimize their online presence. Its audience insights feature allows users to understand their website visitors, including demographics, interests, and behavior. Google Analytics also offers conversion optimization tools to help businesses increase their online conversions.
Key Features :
- Web tracking
- Audience insights
- Behavior analysis
- Conversion optimization
- SEO integration
4. SAS Analytics : Data Analytics tools
Advanced Analytics and Machine Learning
SAS Analytics is a robust data analytics tool that offers advanced analytics and machine learning capabilities. SAS Analytics helps businesses uncover hidden patterns, predict future outcomes, and drive innovation. Its advanced statistical modeling capabilities allow users to build and deploy predictive models. SAS Analytics also offers text analytics and data mining capabilities to help businesses uncover insights from unstructured data.
Key Features :
- Predictive analytics
- Machine learning
- Data mining
- Text analytics
- Advanced statistical modeling
5. Microsoft Excel : Data Analytics tools
Data Analysis and Visualization
Microsoft Excel is a widely used data analytics tool that offers data analysis, visualization, and reporting capabilities. Its features include data analysis, visualization, reporting, spreadsheet analysis, and formula calculation. Microsoft Excel is a popular choice among businesses due to its ease of use and widespread adoption. Microsoft excel using Excel Advanced AI functions, that can be helpful for work easier.
Key Features :
- Data analysis
- Visualization
- Reporting
- Spreadsheet analysis
- Formula calculation
- Pivot tables
6. Zoho Analytics : Data Analytics tools
Self-Service Business Intelligence and Analytics
Zoho Analytics offers self-service BI and analytics. It integrates with various data sources, creates interactive dashboards, and performs in-depth data analysis. Its self-service capabilities enable easy report and dashboard creation. Zoho Analytics is a popular choice due to its ease of use, affordability, and robust features. It’s ideal for businesses of all sizes and offers advanced analytics capabilities like predictive analytics and machine learning.
Zoho Analytics is a popular choice due to its ease of use, affordability, and robust features. It’s ideal for businesses of all sizes and offers advanced analytics capabilities like predictive analytics and machine learning.
Key Features :
- Data integration
- Visualization
- Reporting
- Dashboard creation
- Data analysis
- Statistical analysis
- Collaboration tools
- Cloud-based architecture
- Scalability
- User-friendly interface
7. Python : Data Analytics tools
Data Science and Machine Learning
Python is a popular programming language that offers data science and machine learning capabilities. Its libraries, including NumPy, pandas, and scikit-learn, provide data manipulation, machine learning, data visualization, statistical analysis, and data mining capabilities. Python is a versatile tool that can be used for a wide range of data analytics tasks.
Key Features :
- Data manipulation
- Machine learning
- Data visualization
- Statistical analysis
- Data mining
- Deep learning
- Data visualization tools like Matplotlib and Seaborn
8. Domo : Data Analytics tools
Business Intelligence and Performance Management
Domo is a cloud-based data analytics tool that connects to various data sources, providing real-time insights and performance management capabilities. Domo helps businesses connect to their data, create interactive dashboards, and drive business outcomes. Its performance management capabilities allow users to set goals, track progress, and optimize performance. Domo also offers data integration and visualization capabilities to help businesses make sense of their data.
Key Features :
- Data integration
- Visualization
- Performance management
- Goal setting and tracking
- Cloud-based platform
What are the Benefits of Using Data Analytics Tools?
Data analytics tools offer numerous benefits to businesses, including :
- Improved decision making : Data analytics tools provide insights that can inform business decisions, reducing the risk of relying on gut instincts or anecdotal evidence.
- Increased efficiency : Automation and machine learning capabilities can streamline processes, freeing up resources for more strategic activities.
- Enhanced customer understanding : Data analytics tools can help businesses better understand their customers’ behavior, preferences, and needs.
- Competitive advantage : Businesses that leverage data analytics tools can gain a competitive edge over those that do not.
- Revenue growth : Data analytics tools can help businesses identify new revenue streams and optimize existing ones.
How to Choose the Right Data Analytics Tool?
With so many data analytics tools available, choosing the right one can be overwhelming. Here are some factors to consider :
- Data sources : What data sources do you need to connect to?
- Use cases : What specific use cases do you want to address?
- User adoption : How easy is the tool to use, and will your team adopt it?
- Scalability : Can the tool expand alongside your business as it grows, accommodating increasing data volumes and evolving needs?
- Integration : How well does the tool connect with your existing systems and other software, ensuring seamless workflow and data sharing?
By considering these factors and exploring the tools mentioned above, you can find the right data analytics tool to drive business success.
Conclusion
Selecting the right data analytics tool is crucial for businesses seeking to unlock the full potential of their data. With a plethora of options available, it’s essential to consider your organization’s specific needs and goals. From Tableau’s data visualization prowess to Domo Analytics’ self-service capabilities, each tool offers unique strengths. Businesses can gain a competitive edge, drive informed decision-making, and optimize their operations for success. Moreover, the ability to extract valuable insights from data will become increasingly vital in today’s fast-paced digital landscape. As you navigate the realm of data analytics, remember to choose a tool that aligns with your business objectives, and don’t hesitate to explore the vast possibilities that data analysis has to offer. By doing so, you’ll be well on your way to transforming your data into a treasure trove of actionable insights that drive growth and prosperity.
Frequently Asked Questions (FAQ)
Is Tableau better than Excel?
While both Tableau and Excel are powerful data analysis tools, they serve different purposes. Excel excels in data manipulation and calculation, making it ideal for financial modeling and data management. Tableau, on the other hand, shines in data visualization and storytelling, allowing users to create interactive dashboards and share insights with ease.
Is Tableau still in demand?
Yes, Tableau is still in demand! Its popularity is soaring as organizations seek data-driven insights. Professionals with Tableau skills are in high demand, with roles like Analyst, Developer, and Consultant offering competitive salaries and growth opportunities.
Which type of business analytics is best?
The best type of business analytics is predictive analytics, which uses statistical models and machine learning to forecast future outcomes and drive proactive decision-making. It helps you stay ahead of the competition, optimize operations, and drive revenue growth.


